Posts

Showing posts from December, 2013

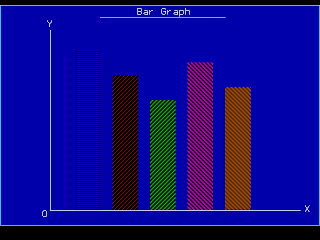
Pie Chart: Using C/C++ and graphics

Image
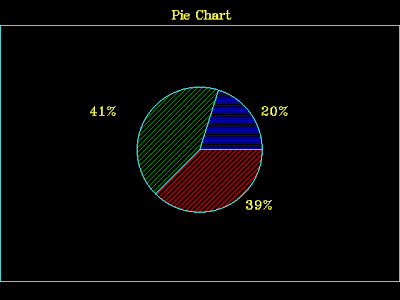
Hey guys, its very simple illustration of pie chart but it is not exactly how it works. In next post I will post how to take input from user and then generate the pie chart and bar graph. Here is the screen shot of the output. Pie-chart using C/C++ and Graphics Here's the code, enjoy coding.. /*     Programmer : Ashok Kumar Shrestha (ak007)     Program details : Pie chart */ #include<stdio.h> #include<graphics.h> #include<conio.h> int main() {    int gd = DETECT, gm, midx, midy;    initgraph(&gd,&gm,"..\\bgi");    setcolor(11);    rectangle(0,40,639,450);    settextstyle(1,0,2);    midx = getmaxx()/2;    midy = getmaxy()/2;    setfillstyle(2,1);    pieslice(midx, midy, 0, 72, 100);    setfillstyle(3,2);    pieslice(midx, midy, 72, 225, 100);    setfillstyle(4,4);    pieslice(midx, midy, 225, 360, 100);    setcolor(14);    outtextxy(275,10,"Pie Chart");    outtextxy(midx-175, midy - 75, "41%");    outtextxy(midx+100

Bar Graph: Using C/C++ and Graphics

Image
Hey guys, today I am going to post simple illustration of bar graph. May be next post I will post how to simulate bar graph with user input. Here is the screen shot of the out put. Bar Graph using C/C++ and Graphics Here is the code, enjoy coding... /*     Progammer : Ashok Kumar Shrestha (ak007)     Program details: Bar Graph */ #include<stdio.h> #include <graphics.h> #include <conio.h> int main() {    int gd = DETECT, gm;    initgraph(&gd,&gm, "..\\bgi");    setfillstyle(1,1);    bar(0,10,639,450);    setcolor(11);    rectangle(0,10,639,450);    line(200,35,450,35);    settextstyle(2,0,7);    setcolor(15);    outtextxy(275,10,"Bar Graph");    line(100,420,100,60);    line(100,420,600,420);    setlinestyle(2,0,7);    outtextxy(95,35,"Y");    outtextxy(610,405,"X");    outtextxy(85,415,"0");    setfillstyle(2,1);    bar(150,100,200,419);    setfillstyle(3,4);    bar(225,150,275,419);    setfillstyle(4,2